Data Analysis Detail: Mouse Behavioral Study
Details for the data analysis section of the Nature Communications paper 'In-vivo integration of soft neural probes through high-resolution printing of liquid electronics on the cranium'
Study Objective
We aim to demonstrate the recording efficacy of the neural interface system developed by Park et al. (2024) in detecting individual and population level neural activities in a freely behaving mouse model.
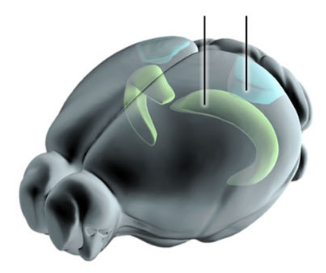
Target Brain Regions
We implant neural brob in two distnct, functionally specialized brain regions to correlate neural activity with specific behavioral states.
| Target Region | Anatomical Location | Functional Association |
|---|---|---|
| CA1 | Hippocampus (Cornu Ammonis 1) | Navigation, spatial memory, and active locomotion. |
| L6 | Primary Visual Cortex (Layer 6) | Visual processing and head-rotation motion. |
Mouse task
Freely moving mice were placed at the start of the long arm of a T-shaped maze. As they traversed the track during the active locomotion phase, we monitored neural activity, specifically anticipating the activation of place units in the hippocampus (CA1). When the mice reached the intersection, they transitioned to a stopping and orienting phase, rotating their heads to scan for visual patterns marking the exit path. This visual discrimination task was expected to drive neuronal activity in the primary visual cortex (L6). Simultaneously, one neural probe recorded from CA1 and another from L6 to capture these region-specific dynamics.

| Task Phase | Behavior | Relevant Brain Region |
|---|---|---|
| Task 1: Locomotion | Running along the long arm | Hippocampus (CA1) |
| Task 2: Orientation | Stopping and head rotation at intersection | Visual Cortex (L6) |
III. Task 1: Active Locomotion Analysis
1. Correlation between Neural Activity and Behavior: visual inspection
To validate the signal fidelity of the probe, we examined how neural activity modulates during locomotion. Reliable recordings should exhibit distinct physiological changes at both the population and individual neuron levels when the mouse transitions from a stopped state to active running. Our data analysis confirms these expected patterns.
| Signal Level | Measurement Method | Behavioral Modulation (Running vs. Stopped) | Evidence |
|---|---|---|---|
| Population (LFP) | Theta Band (4-8 Hz): Extracted via low-pass filtering. | Amplitude: Increases significantly during running. Phase: Trace becomes “denser” (indicating higher frequency and regularity). | Figure 4e,f vs 4h,j |
| Individual (Spikes) | Firing Rate: Extracted via high-pass filtering (>300 Hz) and spike sorting. | Rate: Increases during running, confirming the probe captures behaviorally modulated units. | Figure 4g vs Figure 4d |
2. Statistical Correlation: Spike-Field Phase Locking
In contrast to the visual inspection of behavioral modulation, this analysis employed formal statistical tools—Spectral Clustering and Goodness-of-Fit tests—to strictly quantify the relationship between individual spikes and the population LFP. This validates that the recorded signals are not random noise.
| Analysis Step | Methodology | Results |
|---|---|---|
| 1. Clustering | Applied Spectral Clustering (PCA + k-means) to sorted spikes. | Identified two distinct clusters, suggesting two separate neuronal units with unique waveform patterns. |
| 2. Phase Extraction | Extracted the phase of the LFP (Theta banad) at the exact timestamp of each spike. | Generated a sequence of phase angles for each cluster. |
| 3. Statistical Test | Performed a Goodness-of-Fit test (vs. Uniform Distribution). | Significant p-values: $p=0.001$ (Cluster 1) and $p=0.002$ (Cluster 2). |
| 4. Distribution | Analyzed the distribution of phase angles. | Unimodal: Centered at ~330° (cluster 1) and ~45° (cluster 2) (figures 4-l,m). |
Conclusion: The statistically significant phase locking and different distribution form across clusters confirms that the isolated units are not random noise but are fundamentally coupled to the local neural network. This provides strong evidence that the spike sorting process successfully extracted real, physiologically relevant neuronal signals.
Task 2: Directional Decoding in Visual Cortex (V1 L6)
While Task 1 focused on locomotion in CA1, Task 2 investigated how the Primary Visual Cortex (Layer 6) encodes visual information relative to the observer’s own movement—specifically, head rotation.
The Biological Context: To correctly identify a moving object, the brain must distinguish between “the object moving” and “the eyes moving.” The L6 region integrates visual stimuli with the observer’s motion status (head rotation) to create a stable perception of the world.
1. Signal Quality Verification (Spike Sorting)
The researchers implanted two neural probes in adjacent sites within the L6 region. Using PCA clustering, they successfully isolated four distinct single-unit waveforms. The separation metrics indicated extremely high signal fidelity:
- Isolation Distance: 268.6 and 102.8 (Values >20 are generally considered good).
- L-ratio: 0.0046 and 0.006 (Extremely low values indicate minimal noise contamination).
2. LFP Dynamics: The Slope of the Signal
The researchers monitored the Local Field Potential (LFP) traces during head-rotating behaviors. They observed a distinct linear relationship between the signal’s slope and the direction of the turn:
| Movement Direction | Head Rotation | Neural State | LFP Characteristic (Linear Fit) |
|---|---|---|---|
| Left Turn | Counter-Clockwise | Depolarization | Negative Slope (Decreasing voltage) |
| Right Turn | Clockwise | Hyperpolarization | Positive Slope (Signal increment) |
3. Single-Unit Specificity (Directional Tuning)
Beyond the population-level LFP, individual neurons showed distinct directional biases. When the spike ratios of the PCA-clustered neurons were compared between left-turn and right-turn behaviors:
- Cluster 1 & 2 Neurons: Showed a strong spiking bias toward Left-Turn events (consistent with the depolarization observed in the LFP).
- Cluster 4 Neurons: Showed the opposite bias, firing preferentially during Right-Turn events.
4. Conclusion
These results demonstrate that the neural interface can detect the contextual dependency of visual processing. The neurons in L6 do not merely respond to visual input; they modulate their firing based on the subject’s motion status (head rotation). This aligns with established neurophysiological theories that the visual cortex processes “visual motion” by integrating it with the observer’s own movement trajectory.