Data Analysis Detail: Subsequent Analysis for Biological Interpretation
Principle and practice of mapping the brain's functional architecture into a low-dimensional space.
We are studying how sex (male/female) and disease state (ASD vs. control) interact to affect brain function. We have successfully estimated a Sex x Disease interaction effect. In statistical terms, we have a vector $\mathbf{t}$ of length $P$ (where $P=7$, representing our 7 brain regions/ROIs). Each entry $t_i$ tells us the strength of the interaction in that specific region.
But a vector of t-statistics is just a list of numbers. To make it biologically meaningful, we need to translate these numbers into biological and cognitive semantics. We asked: “If a brain region has a high interaction t-statistic, what cognitive functions or genes are associated with it?”
Here is how we “decoded” the vector using external databases.
-
Cognitive decoding → linking the statistical map to mental functions.
-
Gene enrichment analysis → linking it to patterns of gene expression in the brain.
Cognitive Decoding
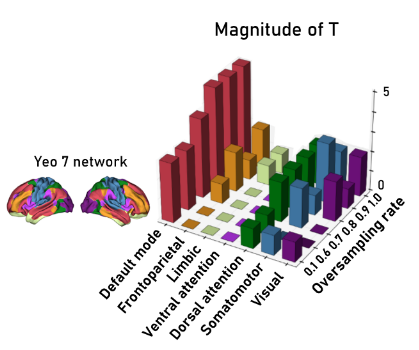
To interpret our vector $\mathbf{t}$, we used NeuroSynth, which is essentially a massive, NLP-mined contingency table of brain activity.
- Data: NeuroSynth database is a giant matrix $\mathbf{C}$ of size $P \times K$.
- Rows (P): Brain regions (our 7 ROIs).
- Columns (K): Cognitive terms (e.g., “Memory”, “Pain”, “Social”, “Motor”).
- Values: The probability that region i is active given the term k appears in a study \(C_{i,k} = P(\text{region } i \text{ is active } | \text{ term } k \text{ appears in a study})\)
-
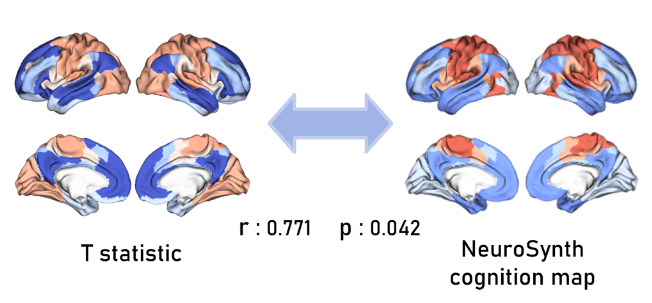
Decoding (Correlation): We simply calculated the correlation between our interaction vector $\mathbf{t}$ and every column in $\mathbf{C}$. \(r_k = \text{Corr}(\mathbf{t}, \mathbf{C}_{., k})\)
- Result:
- Global Alignment (Concept-independent): Our interaction map showed a strong correlation with the First Principal Component (PC1) of NeuroSynth. This PC represents the “gist” of the functional hierarchy—the primary axis of spatial variation in brain function. A high correlation confirms that our interaction effect is strongest in regions with high PC scores (meaningful functional networks), rather than random noise.
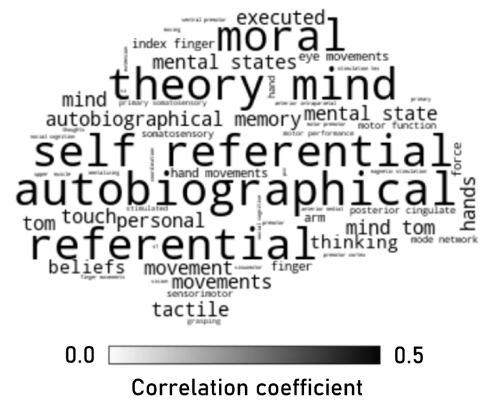
- Specific Cognitive Functions: We subsequently found the highest correlations ($\approx 0.77$) with specific cognitive terms: “Social”, “Moral”, “Theory of Mind”, “Autobiographical”, and “Self-referential”.
- Interpretation: The spatial distribution of the Sex x ASD interaction is nearly identical to the spatial distribution of the brain’s “social network”. The interaction effect isn’t random noise; it’s structurally aligned with high-level cognition.
Gene Enrichment (transcriptomic) Analysis
Goal
Determine if the spatial pattern of Sex × ASD interaction ($\mathbf{t}$) corresponds to specific gene expression profiles.
Method
- Data Source: We used abagen to process microarray gene-expression data from the Allen Human Brain Atlas, generating a region-by-gene matrix ($\mathbf{G}$ of size $P \times M$).
- Correlation: We correlated our interaction vector $\mathbf{t}$ with the spatial expression map of each gene. Genes with strong spatial similarity were identified as “top hits.”
- Enrichment: We applied a developmental enrichment tool (CSEAtool) to determine if these top genes are over-represented in specific brain structures or developmental stages.
Findings
The genes associated with the interaction effect were significantly enriched in the cortex, striatum, and thalamus during development. Previous studies showed an increase in the growth rate of striatal structures in ASD, a reduction in thalamic volume, and dysregulation of thalamocortical networks. Therefore, this confirms again our t-statistic is high in ASD-related regions.
Summary for Statisticians
We treated the biological interpretation as a pattern matching problem.
- Input: A target vector $\mathbf{t}$ (the interaction t-statistics).
- Reference: External high-dimensional matrices (Cognitive definition s $\mathbf{C}$ and Gene expression $\mathbf{G}$).
- Method: Spatial correlation ($\rho$) to identify the feature columns in $\mathbf{C}$ and $\mathbf{G}$ that share the same topology as $\mathbf{t}$.
This allowed us to move from “We found a significant t-test” to “The difference is driven by social processing circuits formed during adolescence”.